How to Test Internet Speed Accurately (Wi‑Fi and Ethernet)
Learn the right way to run an internet speed test for accurate results on Wi‑Fi and Ethernet. Avoid common mistakes and interpret ping, jitter, download, and upload.
Learn the right way to run an internet speed test for accurate results on Wi‑Fi and Ethernet. Avoid common mistakes and interpret ping, jitter, download, and upload.

Testing your internet speed sounds simple, but small mistakes easily skew the results. This guide shows how to get accurate numbers—on both Wi‑Fi and Ethernet—then explains what they mean.
Tip: If run #1 is noticeably slower but #2/#3 converge higher, the first may have been influenced by warm‑up caches or transient background traffic.
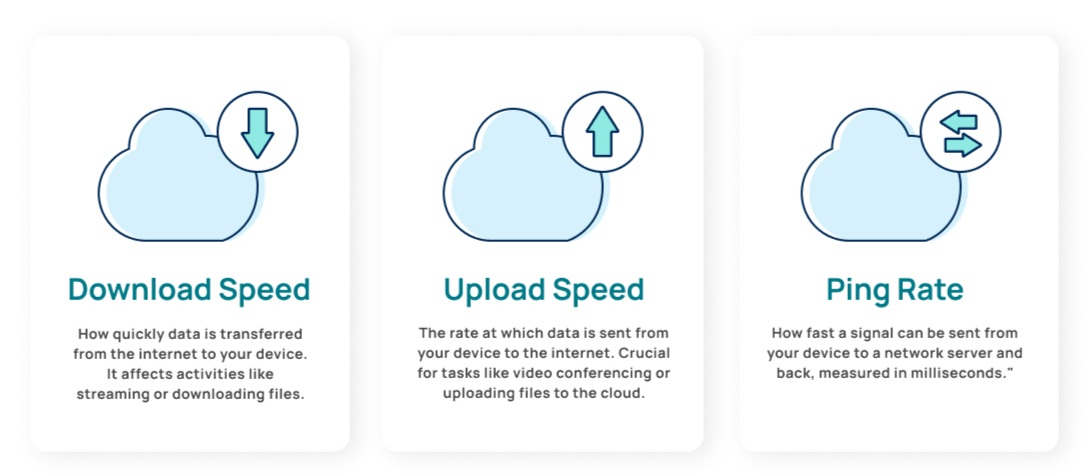
| Metric | What It Is | Good | Caution | Problematic | Primary Impact |
|---|---|---|---|---|---|
| Ping (ms) | Round‑trip latency | <20 | 20–50 | >50 | Gaming, calls |
| Jitter (ms) | Variability of latency | <5 | 5–10 | >10 | Voice/video smoothness |
| Download (Mbps) | Receiving throughput | >Plan × 0.9 | 0.7–0.9× plan | <0.6× plan | Streaming, browsing |
| Upload (Mbps) | Sending throughput | >Plan × 0.9 | 0.7–0.9× plan | <0.6× plan | Calls, backups |
| Packet Loss (%) | Lost packets | 0–0.1 | 0.1–1 | >1 | Calls, gaming, reliability |
| Latency Under Load (ms delta) | Ping increase while saturating link | <30 | 30–100 | >100 | Responsiveness during activity |
A “fast” download with poor jitter still produces choppy calls. Always interpret results as a set—throughput alone is not user experience.
Wi‑Fi introduces shared medium, interference, band contention, and rate adaptation. If Wi‑Fi is slow but Ethernet baseline is fine:
See also: Improve Wi‑Fi Speed (link when available).
| Symptom | Likely Cause | What to Check |
|---|---|---|
| Good ping, low download | Test server saturated or ISP shaping | Try another server / time; run traceroute |
| High ping + low jitter + low throughput | Upstream congestion or peering issue | Compare off‑peak; check ISP status |
| High jitter, variable speeds | Wi‑Fi interference / weak signal | RSSI (aim ≥ -65 dBm), channel overlap |
| Latency spikes only during uploads | Bufferbloat (no QoS) | Enable SQM (cake/fq_codel) |
| Ethernet slow, Wi‑Fi similar | Modem/ISP or plan limit | Confirm provisioned speed with ISP |
| Phone fast, laptop slow | Laptop NIC/driver/power mode | Update drivers, disable power saving |
| All devices slow suddenly | ISP outage / maintenance | Neighbor reports / ISP dashboard |
| Use Case | Download | Upload | Ping | Jitter | Notes |
|---|---|---|---|---|---|
| SD streaming | 3–5 Mbps | 1 Mbps | <80 | <20 | Per stream |
| HD streaming (1080p) | 10–15 Mbps | 3–5 Mbps | <60 | <15 | Per stream |
| 4K streaming | 25–50 Mbps | 5–10 Mbps | <50 | <10 | Headroom helps |
| Video calls (HD) | 10–20 Mbps | 5–10 Mbps | <50 | <10 | Symmetry helps |
| Cloud gaming | 25–45 Mbps | 5–10 Mbps | <35 | <10 | Low jitter critical |
| Competitive FPS | 10–25 Mbps | 3–5 Mbps | <30 | <5 | Stable ping > raw Mbps |
| Large backups | 20–50+ Mbps | 20–50+ Mbps | <80 | <20 | Schedule off‑peak |
Short bursts can inflate peak; sustained speed stability matters for streaming and cloud sync. A smooth graph with minimal dips beats a sharp spike plus troughs. If your speed graph “saws,” suspect Wi‑Fi retries, interference, or ISP shaping cycles.